
A titration curve, a table of initial rates, a cooling curve with two flat steps: these questions test something no topic list names. They are not really asking whether you know kinetics or equilibrium. They are asking whether you can read chemistry off a set of axes in under ninety seconds. Here is a protocol, the four plots worth knowing cold, and the trap that costs most marks.
The skill that sits between the topics
Every revision plan is organised by topic, because syllabuses are organised by topic. Data literacy is not a topic, so it never gets a slot — and yet it turns up in more places on this exam than almost anything else you could revise.
Look at where it appears. In the multiple-choice blueprint ACS publishes, the Descriptive / Laboratory block at questions 7 to 12 and the Kinetics block at questions 25 to 30 are natural homes for data, and equilibrium and states-of-matter questions frequently arrive as a curve rather than as prose. It matters even more further on: Part II of the National Exam is 8 written questions in 105 minutes on chemical theories and models, and Part III is 2 laboratory practicals in 90 minutes, where interpreting what you measured is the task. Confirm the current formats on acs.org, and see our overview of how the USNCO is structured if the parts are new to you.
The reason it deserves separate practice is that failure here does not look like failure. A student who cannot do thermodynamics knows it. A student who misreads a graph produces a confident, wrong number and never revisits it, because nothing felt difficult. That is the most expensive kind of mistake there is.
Five moves, in order, for any graph
The protocol below takes about twenty seconds once it is habitual and it prevents almost every common error. The order matters: students who jump straight to the curve are the ones who compute a beautiful gradient for the wrong quantity.
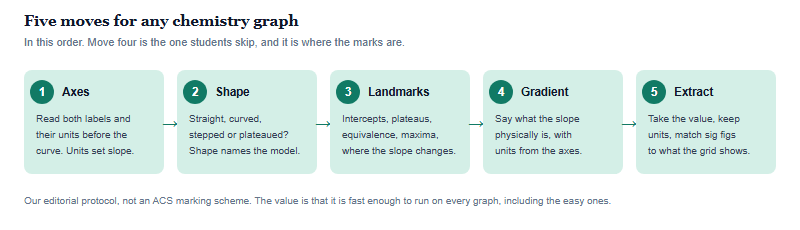
Move four deserves the extra emphasis. “The gradient is −0.0043” is not an answer to anything. “The gradient is the negative of the rate constant, so k is 0.0043 per second” is. Getting into the habit of naming the gradient physically, out loud or on paper, catches the error where you have linearised correctly but forgotten which relationship you were using.
The four plots worth knowing cold
Almost every graph on a chemistry olympiad paper is one of a small number of recurring forms. Knowing them by silhouette means you can complete moves two and four before you have read the caption.
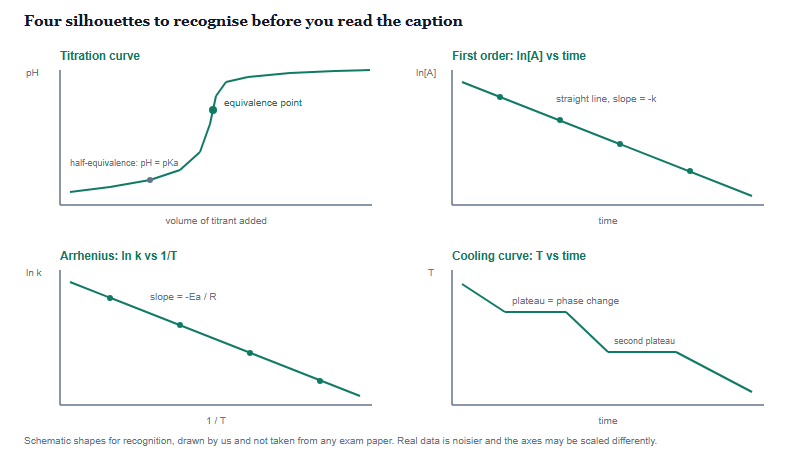
The unifying idea across all of them is linearisation. Chemistry is full of relationships that curve, and the standard move is to transform an axis until the relationship becomes a straight line — because a straight line is easy to test by eye and its gradient carries a physical quantity. So the single most useful question you can ask a plot is: what has been done to the axes, and what does a straight line therefore prove?
| Plot | Axes | A straight line means | The gradient gives you |
|---|---|---|---|
| Zero-order kinetics | [A] against time | Rate independent of concentration | −k |
| First-order kinetics | ln[A] against time | Rate proportional to [A] | −k |
| Second-order kinetics | 1/[A] against time | Rate proportional to [A]2 | +k |
| Arrhenius | ln k against 1/T | Temperature dependence follows Arrhenius behaviour | −Ea/R |
| Clausius–Clapeyron | ln P against 1/T | Vapour pressure follows the expected form | −ΔHvap/R |
| Beer–Lambert | Absorbance against concentration | Absorbance proportional to concentration | Molar absorptivity times path length |
| Titration | pH against volume added | — (read landmarks, not gradient) | Half-equivalence pH gives pKa |
| Cooling or heating curve | Temperature against time | — (a plateau is a phase change) | Sloped sections scale with heat capacity |
Three traps live in this table. First, sign: four of the gradients are negative quantities, and reporting a positive activation energy from a negative slope without the minus sign is one of the most frequent avoidable losses on written papers. Second, a first-order plot has a further signature that needs no graph at all — a constant half-life. If successive halvings of concentration take equal times, the reaction is first order, and you can say so before plotting anything. Third, the equivalence point of a titration is not the end point of an indicator; the first is where the reaction is stoichiometrically complete, the second is where a dye changes colour, and a question that gives you both is usually asking whether you know the difference.
Tables are graphs you have to plot in your head
In our own reading of past papers, data tables are at least as common as graphs on a multiple-choice paper, because they are compact. The classic is a set of initial-rate experiments, and there is a fixed method for reading it.
Find two experiments in which only one concentration changes. Take the ratio of the rates and the ratio of that concentration. If doubling a concentration doubles the rate, the order in that species is one. If it quadruples the rate, the order is two. If nothing happens, the order is zero. When the ratios are not tidy, take logarithms: the order is log(rate ratio) divided by log(concentration ratio), which handles a rate that rises by a factor of 2.8 when a concentration rises by a factor of 1.7. Repeat for each species, add the orders for the overall order, then substitute one full experiment back in to get k — and give k its units, which depend on the overall order and are themselves a favourite thing to test.
The discipline that makes this reliable is the same one that makes laboratory work reliable: only compare rows that differ in one variable. Students who compare two rows in which two concentrations both changed will get an answer, and it will be wrong, and nothing about it will look wrong. If no two rows isolate a single variable, you are being asked to combine results in two steps, which is a harder question deliberately.
The same one-variable logic runs through the descriptive and laboratory questions too. When a table shows results for a series of compounds — solubilities down a group, boiling points along a period, conductivity of a set of solutions — the question is nearly always which single structural variable is changing and which property tracks it. Name the variable first and the pattern usually announces itself.
How much precision to claim, and how to train this
Read-offs have limited resolution, and claiming more than the data supports is a real error rather than a stylistic one. If you read a value off a printed grid, two significant figures is usually the honest ceiling and three is often generous. When you take a gradient, use two points far apart on your drawn line rather than two adjacent data points — a triangle spanning most of the plot averages out the scatter, while two neighbouring points amplify it. And carry a guard digit through the working, rounding only at the end.
Two further habits pay off on the written paper. Always state units with a gradient, taken from the axes rather than remembered: a slope on a plot of ln k against 1/T carries units of kelvin, which is what makes the division by R produce an energy. And never extrapolate beyond the plotted range unless the question asks you to; an intercept obtained by extending a line a long way past the data is a weak answer, and saying so explicitly is often worth a mark.
To train it, use the fact that the paper has a fixed architecture. Because ACS publishes the multiple-choice areas in a fixed order by question number, you can pull the same ranges out of several papers and stack them — questions 25 to 30 across ten papers is a substantial kinetics data set, and questions 7 to 12 gives you the descriptive and laboratory material. Work them as a set of twenty minutes rather than inside whole papers, and mark by asking not only whether the answer was right but which of the five moves you skipped when it was not. Our guide to using past papers properly covers rationing your stock across a season; the pack we have compiled is available by scanning the QR code on this site, and some years come with worked solutions while others do not.
A note on who can sit these papers, since it changes what you are training for. A student who is not a US citizen or permanent resident but attends a US high school may sit the Local Exam and cannot be nominated for the National Exam. A US citizen or permanent resident studying abroad, including inside mainland China, at an accredited American-curriculum school for at least a year and under 20, can run the full route through an ACS International Chemical Sciences Chapter. A student on a Chinese passport at a mainland Chinese school has no ACS entry route; our eligibility guide sets out all three cases. Data literacy is the part of this preparation that transfers regardless: it is the same skill a university laboratory course will assess in your first term, and no certificate is required to acquire it.
Frequently asked questions
How do I find reaction order from a table of initial rates?
Compare two experiments where only one concentration changes, then take log of the rate ratio over log of the concentration ratio.
Which linear plot proves a first-order reaction?
ln[A] against time gives a straight line of gradient minus k. A constant half-life is the same evidence without any plotting.
How many significant figures should a read-off have?
Usually two, occasionally three. Take gradients from widely separated points on your drawn line, not from adjacent data points.
Where do data questions appear on the exam?
Across the multiple-choice blocks, and heavily in the written and practical parts of the National Exam. Confirm current formats on acs.org.
This is the USNCO information desk, synchronising official ACS information for chemistry students in China, operated by Hanlin Education. The USNCO is run by the American Chemical Society (ACS), which sets all official rules and eligibility. Always confirm current details on acs.org. Errors are corrected within 7 working days of notice.