
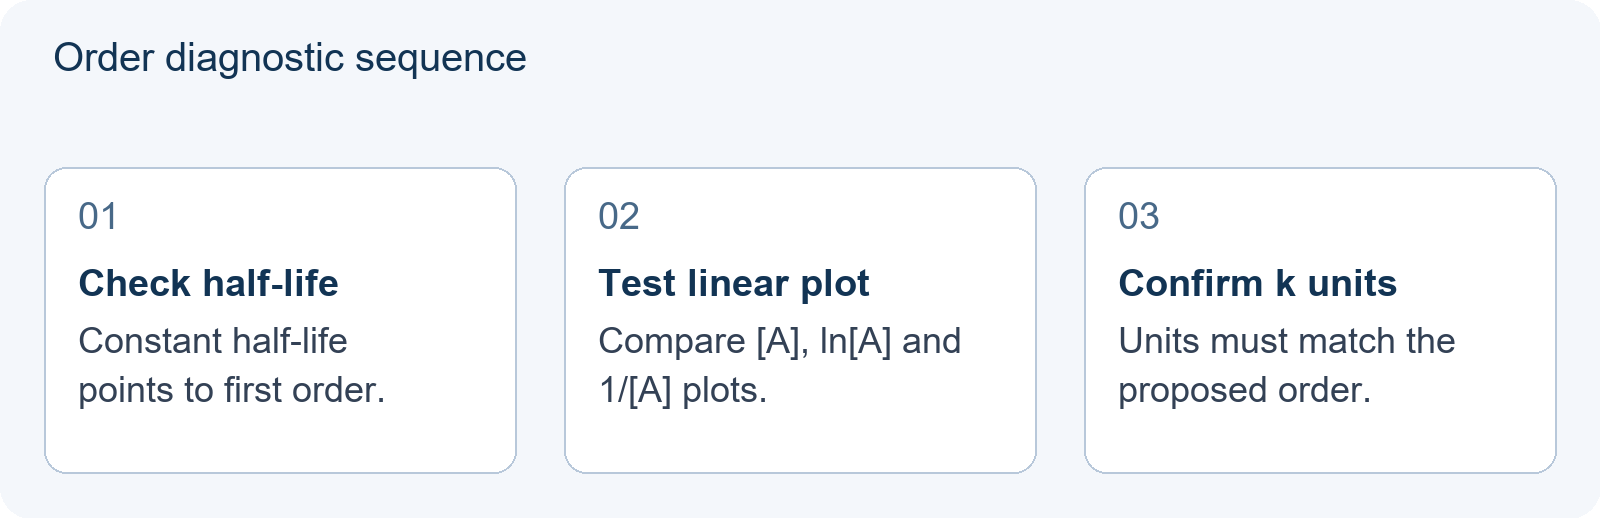
For USNCO kinetics, the safe answer is: determine reaction order from experimental data, not from the balanced equation. In a concentration-time table, first test whether half-lives are constant; then compare linearised plots; then confirm k and its units. A constant half-life identifies first order for a single-reactant A → products case. A linear [A]-versus-time plot identifies zero order. A linear 1/[A]-versus-time plot identifies second order. If the question gives initial rates, compare how rate changes when one concentration changes while the others are held constant. This is independent preparation commentary, not official ACS or USNCO scoring guidance.
Start with the question the table is asking
A kinetics table is not asking you to recite a rate law. It is asking which mathematical model fits the measured concentrations. For a single reactant A → products, the three common models are zero order, first order and second order. Each has a different integrated form, a different linear test, a different rate-constant unit and a different half-life behaviour. That is why the first move is diagnostic, not algebraic.
Write down what is measured. If the table gives concentration and time, use the integrated forms. If it gives a series of experiments with initial concentrations and initial rates, use the rate-ratio method. Do not mix the two without saying so. A common loss of marks is to calculate an average rate over a long interval and then treat it as the instantaneous initial rate. Those are different quantities, and for first order they give different numbers.
Keep the reaction stoichiometry separate from the empirical order. The equation A → products does not tell you whether the reaction is first order in A. Order is experimental. A proposed mechanism may suggest an order, but the table must support it.
What the USNCO preparation context changes
Hanlin’s 27 September 2026 comparison, ‘UKChO/CCO/USNCO… Five Major Chemistry Competitions: Which One Fits You?’, describes USNCO as covering all of AP Chemistry plus parts of first-year university chemistry. It says multiple-choice questions test breadth while short-answer questions test depth. The same comparison lists USNCO’s theoretical emphasis as inorganic chemistry, analytical chemistry, chemical equilibrium and electrochemistry, and notes an experimental component covering laboratory skills, data recording and results analysis.
That context matters for kinetics. A multiple-choice item may ask for a quick order read from a table, while a written item may require a justification: why this order, why this plot, why these units. The practical preparation aim is therefore not only to get the order right but to make the reasoning inspectable. For adjacent work on reading tables under time pressure, see The Graph and Table Questions: Reading Chemistry Data Under USNCO Time Pressure (2026).
The source comparison is a coaching judgment about syllabus coverage and question style, not an official mark scheme. Treat it as a guide to what to practise, not as a promise about any particular paper.
The three order signatures
For a single reactant A → products, use the following three-way diagnostic. The linear plot is the strongest visual test, but the half-life pattern and the units should agree with it.
| Order in A | Linear test | Slope | Units of k | Half-life check |
|---|---|---|---|---|
| Zero | [A] versus t | −k | M s−1 | t1/2 = [A]0 / (2k); successive half-lives shorten |
| First | ln[A] versus t | −k | s−1 | t1/2 = ln 2 / k; constant |
| Second | 1/[A] versus t | +k | M−1 s−1 | t1/2 = 1 / (k[A]0); successive half-lives lengthen |
Do not choose an order because one plot looks roughly straight by eye. Compare all three plots, check at least three or four points across a useful range, and ask whether the residuals show a systematic curve. A single point cannot distinguish the models reliably.
A labelled teaching illustration: first-order data
The following is a hypothetical teaching illustration, not an actual USNCO problem and not official scoring material. Suppose A → products gives the concentration-time data below.
| Time / s | [A] / M |
|---|---|
| 0 | 0.100 |
| 10 | 0.0500 |
| 20 | 0.0250 |
| 30 | 0.0125 |
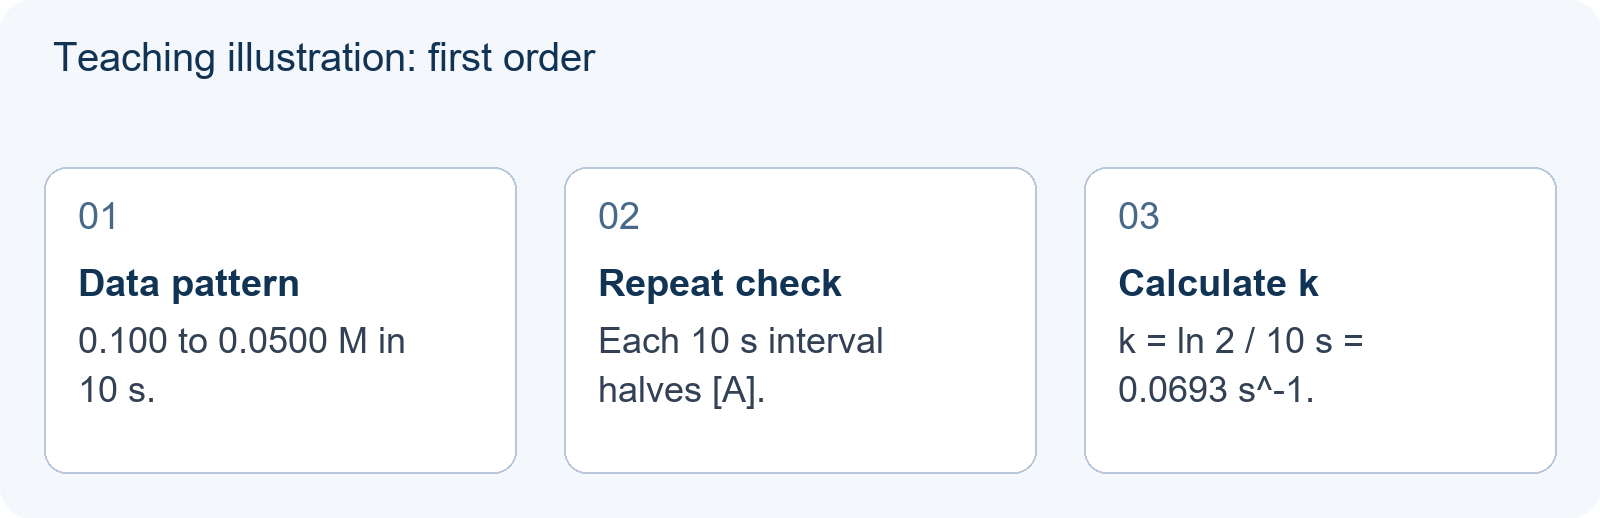
Each 10 s interval halves the concentration: 0.100 to 0.0500, then to 0.0250, then to 0.0125. The half-life is constant at 10 s. That is the signature of first order in A.
Use the first-order half-life relation:
k = ln 2 / t1/2 = 0.693 / 10 s = 0.0693 s−1.
Check with the integrated form: ln([A]/[A]0) = −kt. From 0 to 10 s, ln(0.0500/0.100) = ln(0.5) = −0.693. Dividing by 10 s gives k = 0.0693 s−1. The units are s−1, which agrees with first order.
Now distinguish average rate from initial rate. The average rate from 0 to 10 s is −(0.0500 − 0.100) / 10 = 0.00500 M s−1. The initial instantaneous rate is k[A]0 = 0.0693 × 0.100 = 0.00693 M s−1. The two are not interchangeable. If the question asks for the initial rate, do not use the 10 s average.
Contrast with zero- and second-order data
For a zero-order reaction, [A] falls by a constant amount per unit time. A hypothetical example with k = 0.0050 M s−1 and [A]0 = 0.100 M gives [A] = 0.100 at 0 s, 0.050 at 10 s and 0.000 at 20 s. The plot of [A] against time is linear with slope −k. The initial half-life is [A]0 / (2k) = 0.100 / (0.010) = 10 s, but the next half-life, from 0.050 M to zero, is only 5 s. A changing half-life rules out first order.
For a second-order reaction in A, plot 1/[A] against time. A hypothetical example with k = 0.50 M−1 s−1 and [A]0 = 0.100 M gives 1/[A] values of 10.0, 15.0, 20.0 and 25.0 at 0, 10, 20 and 30 s. The plot is linear with slope +k = 0.50 M−1 s−1. The half-life from 0.100 M to 0.0500 M is 20 s; the next half-life, from 0.0500 M to 0.0250 M, is 40 s. Successive half-lives lengthen.
These contrasts are useful because a student who only memorises ‘first order means constant half-life’ may still misread a zero-order table where the concentration falls linearly. The diagnostic must include the plot shape and the units.
Initial rates, average rates and pseudo-first-order conditions
When a question supplies initial rates, compare experiments in which only one reactant concentration changes. If doubling [A] doubles the initial rate, the reaction is first order in A. If doubling [A] quadruples the rate, it is second order in A. If doubling [A] leaves the rate unchanged, it is zero order in A. These comparisons assume the other reactants and the temperature are held constant.
For a two-reactant rate law such as rate = k[A]m[B]n, the overall order is m + n, and the units of k depend on that overall order. A common examination device is pseudo-first-order conditions: one reactant is present in large excess so its concentration is approximately constant during the measurement. The observed rate law then looks first order in the other reactant, and the measured constant is a composite. State that assumption explicitly if you use it.
For topic-specific practice on this distinction, USNCO Quizzes: Build Topic-Specific Practice Sets From Past Papers (2026) is the relevant site page. The aim is to practise the decision, not to collect more formulas.
Units, half-life and significant figures
Rate always has units of concentration per time, M s−1. If rate = k[A]n for a single reactant, then k has units M(1−n) s−1. Zero order gives M s−1; first order gives s−1; second order gives M−1 s−1. For a multi-reactant rate law, replace n with the overall order. Checking units is a fast way to catch an order mistake before the final answer.
Half-life is a consistency check, not a substitute for the full data set. First order has a constant half-life. Zero order has a half-life that shortens as concentration falls. Second order has a half-life that lengthens as concentration falls. If the question states a half-life and asks for the order, test which model makes that half-life behaviour possible.
Keep significant figures under control. In the teaching illustration, 0.0693 s−1 is justified by the data given; 0.07 s−1 may be acceptable in some contexts but loses information. Also keep the sign of the slope. For [A] versus time and ln[A] versus time, the slope is negative; for 1/[A] versus time, it is positive.
An error audit and a 25-minute self-check
Use a short audit after each kinetics table. Did you identify what is measured: concentration-time or initial rate? Did you test all three order models? Did you state the order in A and, if relevant, the overall order? Did you calculate k from the correct slope or half-life relation? Did you attach the correct units? Did you distinguish average rate from initial rate? Did you keep the sign of the slope?
A 25-minute self-check can be simple. Take three concentration-time tables. For each, spend about six minutes classifying the order, calculating k and writing one sentence that rules out the other two orders. Spend the remaining minutes comparing your justifications. The sentence matters: ‘The half-life is constant, so first order’ is stronger than a bare number. For marking your own reasoning rather than only the answer, use a mark-scheme audit rather than an answer key alone.
If you request help from a teacher or programme, make the request specific. Bring two or three tables, your attempted plots and one sentence of justification for each. Ask for feedback on the diagnostic step, the units and the written reasoning. That is more useful than asking for a score prediction, and it does not require any promise about awards or admissions.
For past-paper explanations that go beyond a key, USNCO Past Papers: Requesting Explanations Beyond an Answer Key is the adjacent site resource. The goal is to make each table teach a decision rule you can reuse.
General event background is available at Event background.
This is an independent preparation guide, not affiliated with, endorsed by, or sponsored by the American Chemical Society.
Frequently Asked Questions
Can I determine reaction order from the balanced equation alone?
No. Reaction order is empirical and must come from rate data. The balanced equation gives stoichiometry, not the rate law. A proposed mechanism may suggest an order, but the concentration-time or initial-rate data must support it.
What if the half-life is not constant?
Then the reaction is not first order in that reactant under the stated conditions. Test the zero-order plot of [A] versus time and the second-order plot of 1/[A] versus time, and check that the units of k agree with the order you choose.
How many data points should I use to decide the order?
For a teaching check, use at least three or four concentration-time points across a useful range, and compare all three linear tests. With initial-rate experiments, compare at least two runs where only one concentration changes. More points improve the diagnosis, but the justification should still name the plot, half-life pattern and units.